
The Session Report is a report in the Reporting Tool of Firstbeat Sports Cloud that shows the training data of one session for the whole team or for one athlete. A Session Report is available only for a session created live in the Firstbeat Sports: Coach app or afterwards in Sports Cloud.
Team view
- General overview: session details (Sport, Athletes, Date, Start time, End time, Duration, Type) and a Notes field.
- Notifications: a new maximum heart rate (HRmax) detected for an athlete, which you can revert, or a Waiting measurement for missing Sensor data. Click ADD MANUAL ENTRY to add the exercise manually.
- Team Training Chart: the team median and range of variation for the selected metrics. Use the slider to check time points. Below the chart, bars show the team average time in each heart rate zone (HR zone) and dots show individual athletes.
- Summary Cards: the team average and the averages per position or group for each metric. History Comparison (Sports Premium+) compares the session with earlier sessions that have the same name, type or weekday.
- Athlete Ranking: each athlete's values compared with the athlete's own history. Sort by a column with the sort icon. Laps or drills tagged live in the Coach app or afterwards in Sports Cloud have their own rows. Click the arrow next to a row to see the values of each athlete.
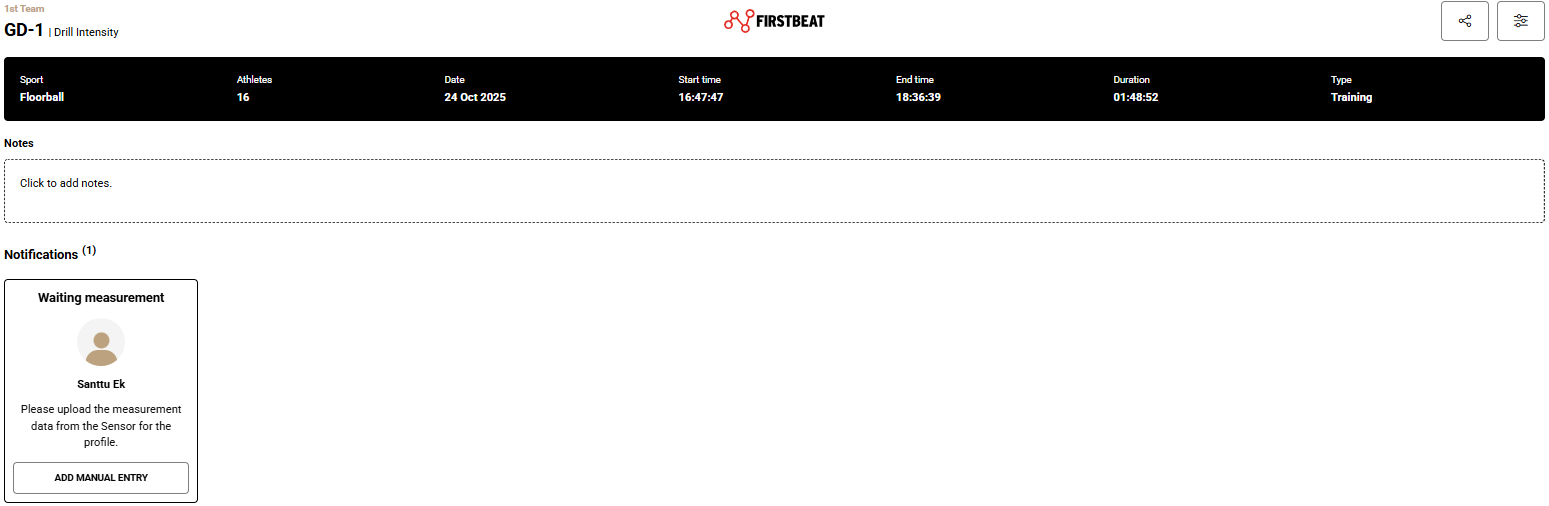
Screenshot: the team Session Report overview with a Waiting measurement notification and the ADD MANUAL ENTRY button.
Athlete view
Click the team logo in the top-left corner of the Reporting Tool and select an athlete.
- Measurement Report: available only in the athlete view. The Measurement Report includes all data from a measurement, from start to stop.
- Training History: the athlete's daily training load as training impulse (TRIMP), a cumulative variable that describes training load. See the Training History chart section below.
- Training Chart: the selected metrics, with the athlete's beats per minute (bpm) range, time and share of the session for each HR zone.
- Summary Cards: the session values, with History Comparison (Sports Premium+).
- Laps: lap values as bars and historical values as dots. With custom reports (Sports Premium+), Lap name and session compares laps with the same name within the selected sessions, and Lap name only compares laps with the same name across all team training sessions.

Screenshot: the Training History chart with daily TRIMP bars, the Acute Load line and the balanced range.
Training History chart
- Golden bars: the TRIMP sum for each day.
- Black line: the Acute Load, the TRIMP sum of the last 7 days.
- Grey area: the balanced range, the Chronic Load (28-day TRIMP sum divided by 4) multiplied by 0.8 to 1.3.
- Red dots: games.
- Blue area: the selected day.
- Today: the TRIMP sum of the selected day and its share of the Acute Load.
Need more help? Ask the Customer Agent chat on this page or email support@firstbeat.com.