
Reporting Tool example reports show what the six reports of the Reporting Tool in Firstbeat Sports Cloud look like: the Session Report, the Training Summary Report and the Submaximal Fitness Test Report, each in a team version and an athlete version. All reports are interactive in the browser, so you can drill down to individual athletes and details.
Team Session Report
The Team Session Report shows one team session. The example is a floorball game.
- General overview: session details (Sport, Athletes, Date, Start time, End time, Duration, Type), Notes and notifications, such as a new maximum heart rate (HRmax) or missing athlete data.
- Team Training Chart: team median and range of variation, with time in each heart rate zone (HR zone). Dots show individual athletes.
- Summary Cards: team and position values for each metric, with History comparison (Sports Premium+).
- Athlete Ranking: each athlete's values, including laps, compared with the athlete's own history.
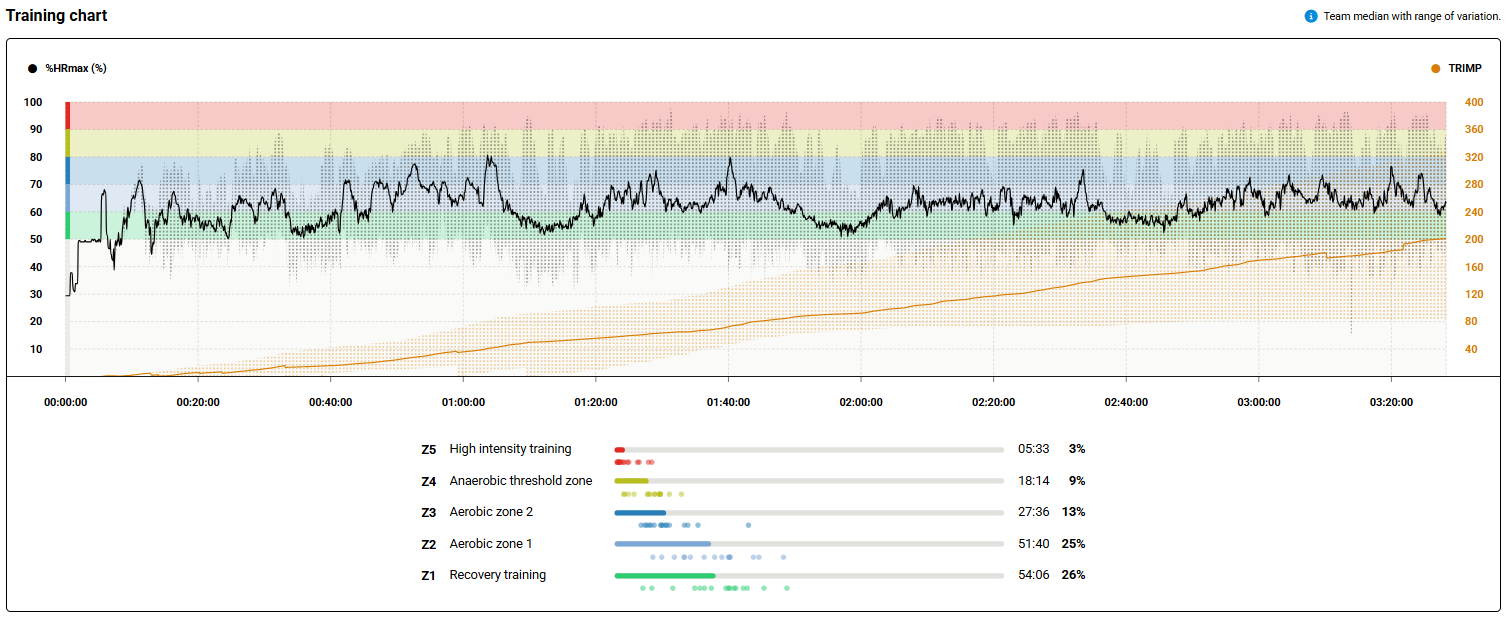
Screenshot: the Team Training Chart of the example Team Session Report with time in HR zones and athlete dots.
Athlete Session Report
The Athlete Session Report shows one athlete in one session. In the athlete view, a Measurement Report covers a measurement from start to stop.
- General overview: session details, the athlete Profile, Notes and Training Load (Acute, Chronic and Today).
- Training chart, Summary Cards with History comparison, and Laps compared with historical values.
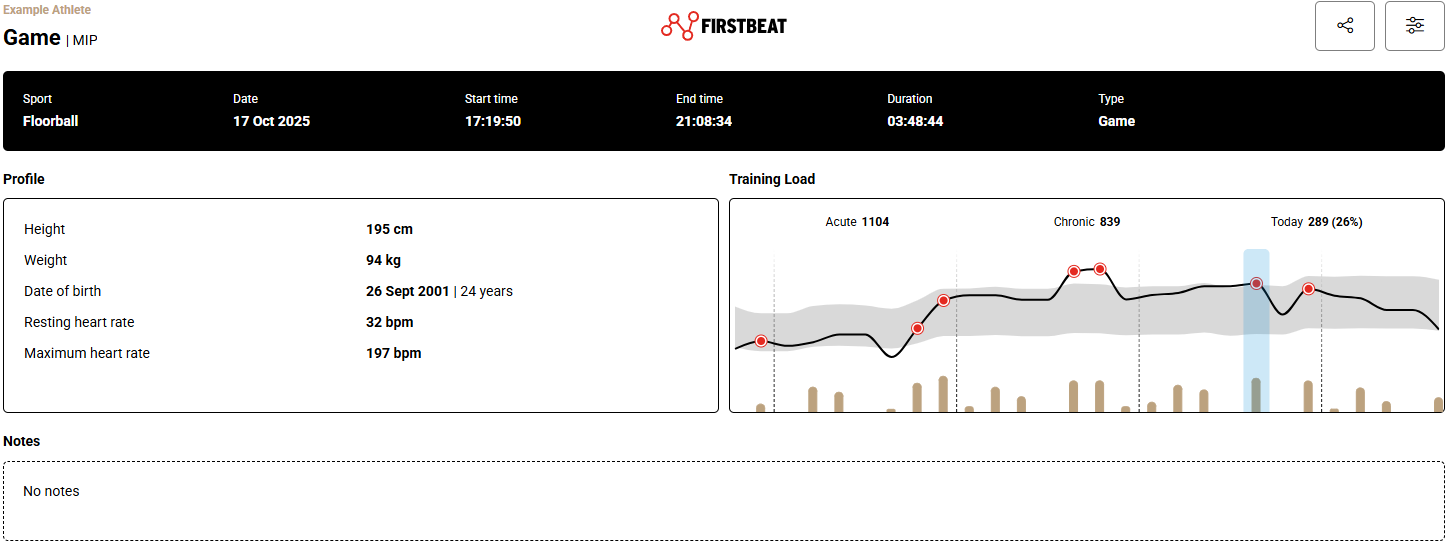
Screenshot: the top of the example Athlete Session Report with the Profile box and the Training Load chart.
Team Training Summary Report
The Team Training Summary Report (Weekly Report, Sports Premium+) summarizes the training of a team.
- Training History: 12 weeks of daily training impulse (TRIMP) bars, the Acute load line, the Balanced range and Game / Race dots.
- Weekly Values: Team TRIMP and Team Training Effect for the last 7 days.
- Athletes: Quick Recovery (7D), Acute load with 7-Day change, Load ratio, and TRIMP and Training Effect minibars for each athlete.
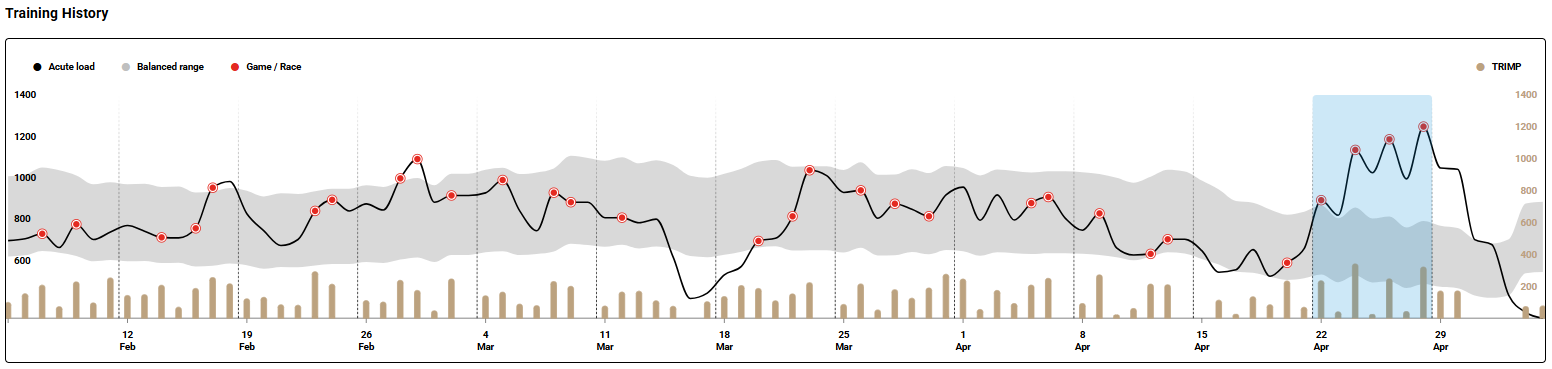
Screenshot: the Training History chart of the example Team Training Summary Report with the last 7 days in blue.
Athlete Training Summary Report
The Athlete Training Summary Report (Sports Premium+) shows the Training History chart and the TRIMP and Training Effect charts of one athlete.
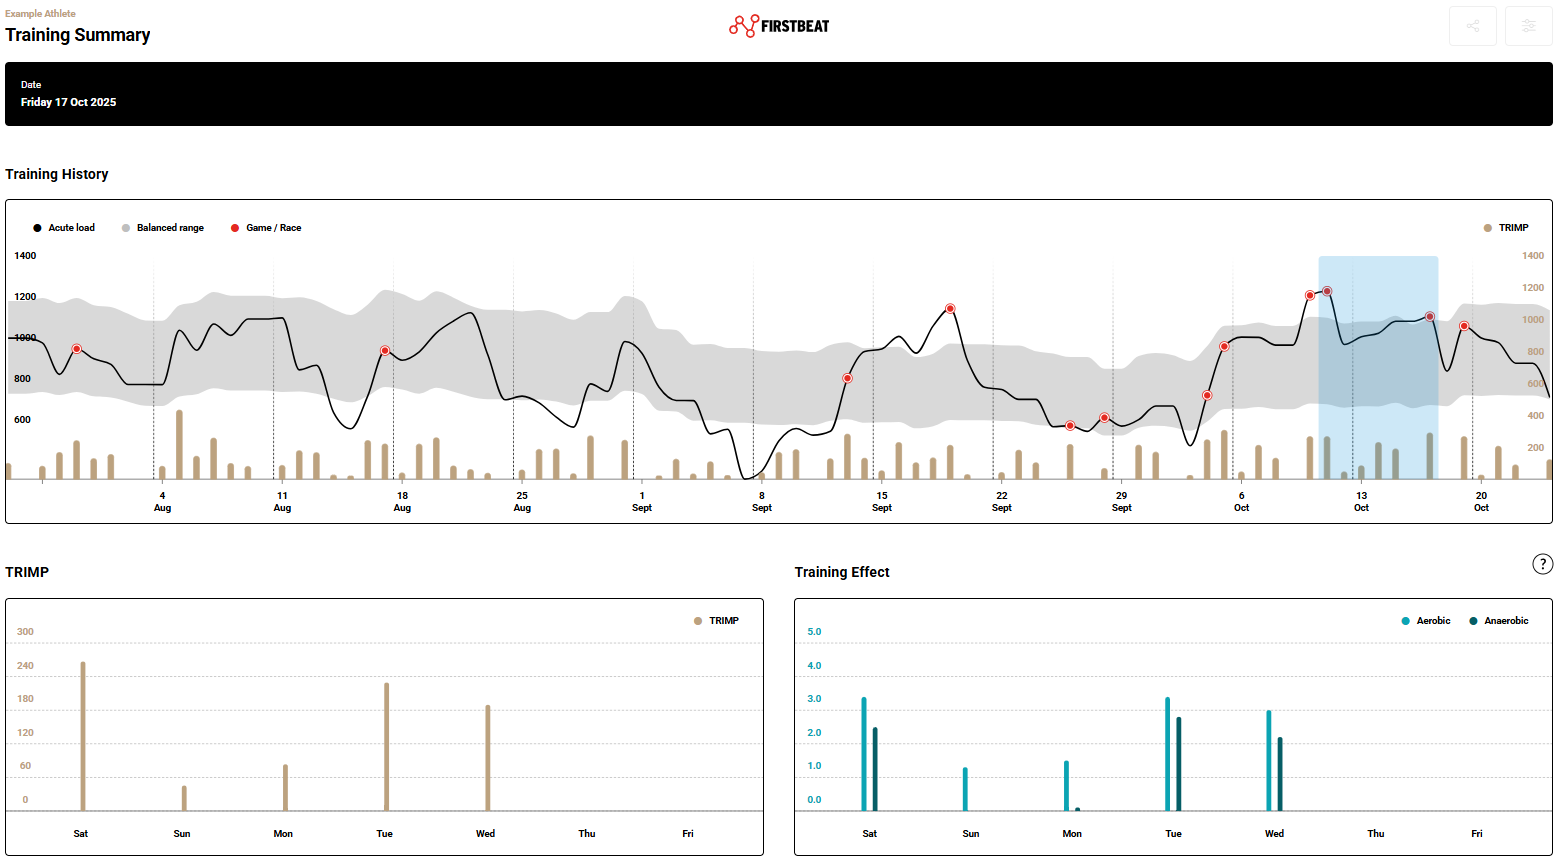
Screenshot: an example Athlete Training Summary Report with the Training History, TRIMP and Training Effect charts.
Team Submaximal Fitness Test Report
The Team Submaximal Fitness Test Report (Submaximal testing add-on) shows the test results of a team.
- Team Summary: Peak %HRmax (60s) and Heart rate recovery (60s, %) for each athlete, with the change from the previous test (From previous column).
- Comparison Chart: the %HRmax curves of all athletes and the heart rate recovery period.
- Athletes: results with Z-Score | Absolute Difference and test history against the Baseline (within ± 1 SD).
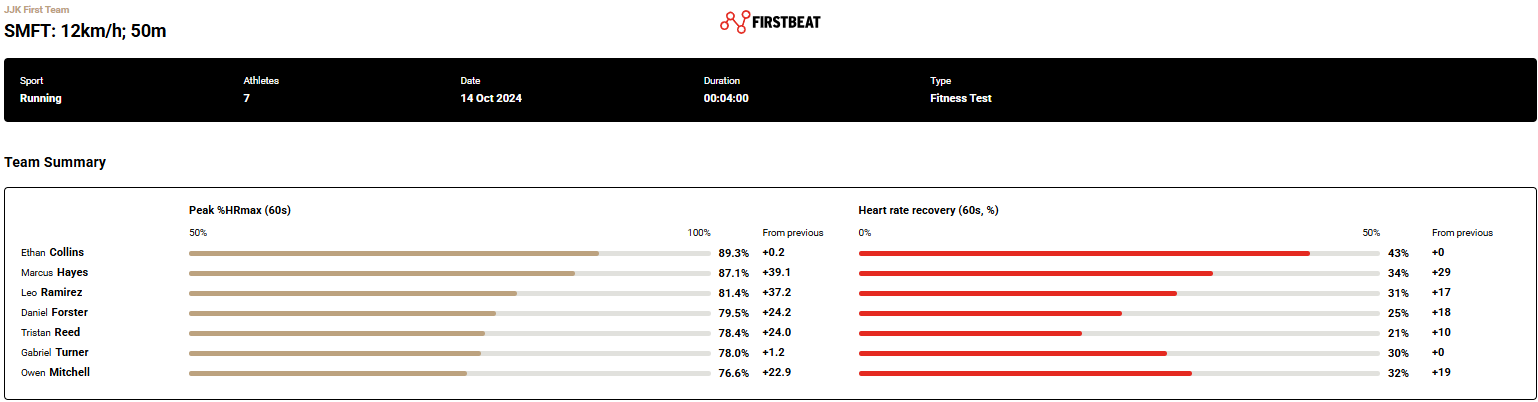
Screenshot: the top of the example Team Submaximal Fitness Test Report with the Team Summary for each athlete.
Athlete Submaximal Fitness Test Report
The Athlete Submaximal Fitness Test Report shows the same information for one athlete, with the Athlete Summary, the Comparison Chart and the test history.
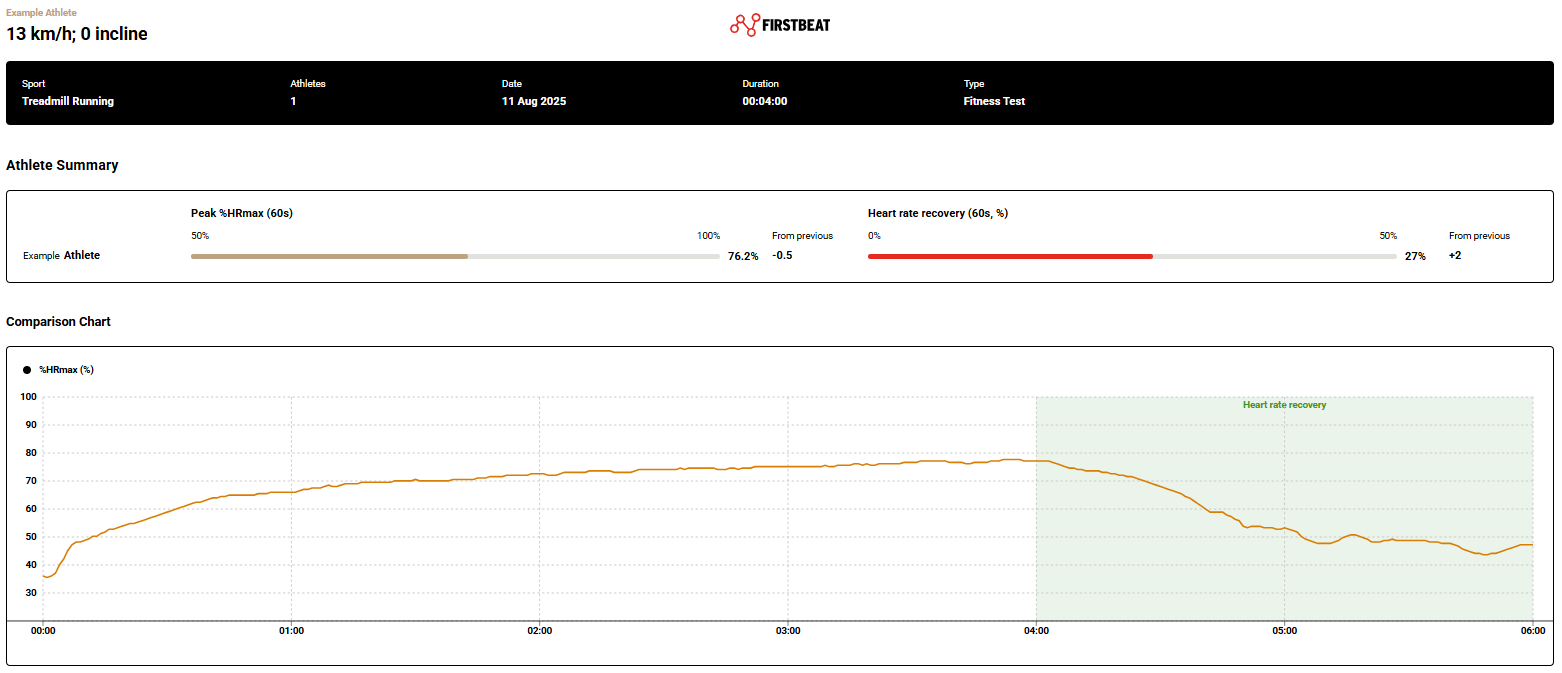
Screenshot: the top of the example Athlete Submaximal Fitness Test Report with the Athlete Summary and the Comparison Chart.
Need more help? Ask the Customer Agent chat on this page or email support@firstbeat.com.